If you’re reading this, you’re likely concerned about how IV therapy might impact your blood sugar levels—whether you’re managing diabetes, preparing for a medical procedure, or considering wellness IV treatments. We understand these concerns are valid and important for your health decisions. Rest assured, you’ve found a comprehensive resource that addresses exactly what happens to blood glucose during IV therapy, backed by the latest clinical research and expert guidelines.
IV therapy’s effect on blood glucose levels is the complex interaction between the type of IV solution administered, your individual metabolic state, and the monitoring protocols in place. During IV therapy, dextrose-containing fluids can cause blood glucose to rise significantly—with studies showing 60% of patients experiencing hyperglycemia above 150 mg/dL—while crystalloid solutions like Ringer’s Lactate maintain stable glucose levels throughout treatment. This physiological response occurs because stress hormones during illness increase hepatic glucose production while simultaneously impairing peripheral tissue utilization, creating a perfect storm for blood sugar fluctuations that requires careful management through validated protocols and frequent monitoring.
TL;DR Summary:
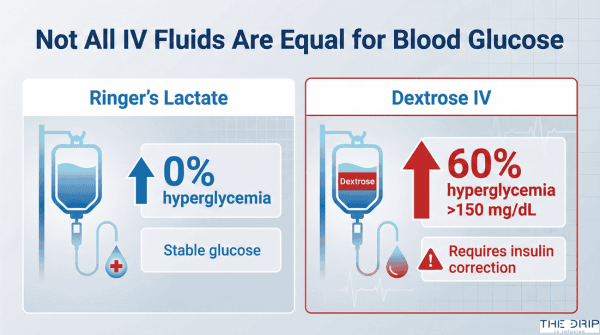
• IV Solution Type Matters Most: Ringer’s Lactate maintains stable blood glucose with zero hyperglycemic events, while dextrose-containing solutions cause 60% of patients to experience blood sugar spikes above 150 mg/dL.
• At-Risk Populations Need Extra Vigilance: Patients with diabetes show 48.9% hypoglycemia rates during hospitalization, with non-diabetic patients paradoxically experiencing higher mortality (60.2% vs 37.0%) when hypoglycemia occurs.
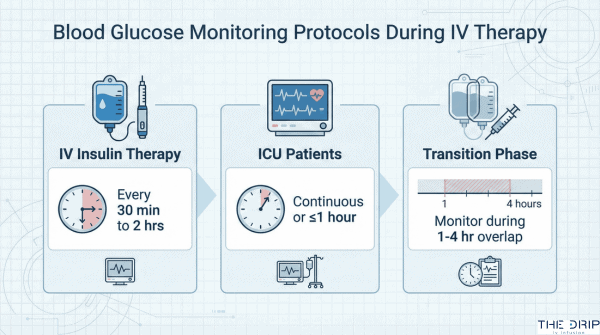
• Monitoring Frequency Is Critical: Blood glucose must be checked every 30 minutes to 2 hours during IV insulin therapy, with continuous monitoring recommended for critically ill patients per SCCM guidelines.
• Clear Glycemic Targets Exist: Target ranges are 140-180 mg/dL for ICU patients and 100-180 mg/dL for non-ICU patients, with targets below 110 mg/dL not recommended due to hypoglycemia risk.
• Complications Are Preventable: Hypoglycemia affects 12.7% of ICU patients and increases mortality to 48.9%, but standardized protocols and specialist consultation can minimize these risks.
• Economic Impact Is Substantial: Proper glycemic management shows 467% return on investment through reduced complications, despite diabetes care costing the U.S. healthcare system $413 billion annually.
Quick Tip: If you’re scheduled for IV therapy and have any blood glucose concerns, request Ringer’s Lactate instead of dextrose-containing solutions when medically appropriate—this simple change can prevent unnecessary blood sugar spikes while maintaining proper hydration.
What Is the Relationship Between IV Therapy and Blood Sugar Regulation?
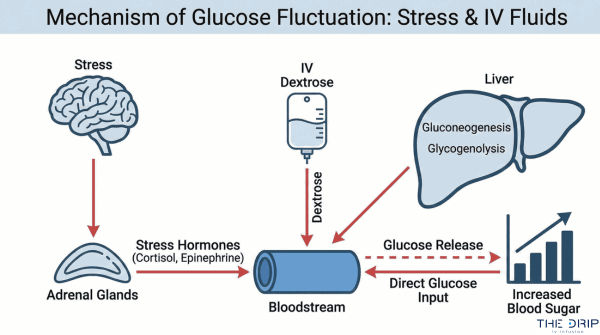
The relationship between IV therapy and blood sugar regulation is direct and measurable—IV fluids containing dextrose significantly increase blood glucose levels while non-dextrose solutions maintain stable glucose control. A 2019 randomized controlled trial at Seoul National University Hospital on perioperative glucose management found that dextrose-containing IV fluids caused hyperglycemic events (blood glucose >150 mg/dL) in 60% of patients (n=200). The mechanism involves both the glucose load from dextrose solutions and the body’s stress response during illness, which increases hepatic glucose production through gluconeogenesis and glycogenolysis. Understanding how different IV solutions affect blood glucose helps clinicians select appropriate fluids and monitoring protocols.
How Do Different Types of IV Solutions Influence Blood Glucose?
Different types of IV solutions influence blood glucose through their dextrose content and metabolic effects. Ringer’s Lactate solution maintains stable blood glucose with zero values exceeding 150 mg/dL during surgery in nondiabetic patients. In contrast, 0.45% dextrose normal saline causes hyperglycemic events in 60% of patients.
The glucose response varies by solution type:
| Solution Type | Glucose Effect | Clinical Outcome | Source |
| Ringer’s Lactate | No elevation | 0% hyperglycemia rate | Seoul 2019 |
| 0.45% Dextrose NS | Significant rise | 60% hyperglycemia rate | Seoul 2019 |
| Dextrose solutions | 145±8.42 mg/dL post-op | Higher insulin need | Seoul 2019 |
| Crystalloid only | 138±9.34 mg/dL post-op | Stable glucose | Seoul 2019 |
Dextrose-containing IV fluids show significantly higher blood glucose levels (P < 0.001) during both intraoperative and postoperative periods. Crystalloid solutions without dextrose remain preferable for perioperative maintenance due to superior glucose stability.
What Is the Mechanism Behind IV Fluids Raising or Lowering Blood Sugar?
The mechanism behind IV fluids raising or lowering blood sugar involves hormonal responses and metabolic pathways. Stress during illness increases catabolic hormones such as cortisol and glucagon, leading to increased hepatic glucose production. General anesthesia results in higher blood glucose than local or epidural anesthesia due to elevated circulating catecholamines.
Key mechanisms include:
- Increased hepatic glucose production via gluconeogenesis and glycogenolysis
- Impaired glucose utilization by peripheral tissues during IV therapy
- Acute hyperglycemia (>180-200 mg/dL) impairs endothelial nitric oxide generation
- Reduced vasodilation from hyperglycemia-induced vascular dysfunction
These metabolic changes explain why even nondiabetic patients may experience glucose fluctuations during IV therapy. The next section examines which patient populations face the highest risk for these blood glucose changes.
Who Is Most at Risk for Blood Glucose Changes During IV Therapy?
Certain patient populations face significantly higher risks of blood glucose fluctuations during IV therapy. A 2020 study found U.S. hospital discharges with diabetes reached 7.86 million, while diabetes prevalence in the inpatient population increased 2.5% annually from 17.1% in 2000 to 27.3% in 2018. The following sections examine which conditions and populations require enhanced monitoring and precautions during IV therapy administration.
How Do Conditions Like Diabetes Affect IV Therapy Outcomes?
Diabetes affects IV therapy outcomes by increasing both hospitalization rates and blood glucose instability risks. Patients with diabetes have a 3-4 fold greater chance of hospitalization compared to non-diabetics. A clinical study revealed diabetes diagnosis is associated with a 48.9% hypoglycemia rate versus 34.0% in non-diabetics (P<0.001).
The mortality impact differs between diabetic and non-diabetic populations experiencing hypoglycemia. Non-diabetic patients with hypoglycemia show 60.2% mortality versus 37.0% in diabetic patients (P<0.001). This paradoxical finding suggests non-diabetics may lack protective metabolic adaptations that diabetics develop over time.
Healthcare systems face increasing challenges managing diabetic patients receiving IV therapy, as diabetes prevalence continues rising in hospital settings.
What Precautions Should Be Taken for Vulnerable Populations?
The precautions for vulnerable populations include enhanced monitoring protocols and adjusted IV therapy approaches based on specific risk factors. Multiple patient characteristics correlate with increased hypoglycemia risk during IV therapy:
| Risk Factor | Higher Risk Group | Lower Risk Group |
| Age | 66.7±15.6 years | 64.1±15.9 years |
| BMI | 23.6±4.6 | 24.5±4.7 |
| Mechanical Ventilation | 85.5% hypoglycemia rate | 68.2% without ventilation |
| Renal Replacement | 37.1% hypoglycemia rate | 10.2% without dialysis |
| Comorbidity Index | 2.7±1.6 (higher) | Lower scores |
Patients requiring mechanical ventilation face the highest hypoglycemia risk at 85.5%. Renal replacement therapy patients show a 37.1% hypoglycemia rate versus 10.2% in those without dialysis. A higher Charlson Comorbidity Index score of 2.7±1.6 correlates with increased hypoglycemia risk.
These vulnerable populations require individualized IV therapy protocols with more frequent glucose monitoring and conservative fluid selection to minimize blood glucose fluctuations.
When Should Blood Glucose Be Monitored During IV Therapy?
Blood glucose monitoring during IV therapy is essential for patient safety, particularly for those receiving insulin infusions or at risk for glycemic fluctuations. The American Diabetes Association (ADA) recommends monitoring blood glucose every 30 minutes to 2 hours for patients on IV insulin therapy. According to Society of Critical Care Medicine (SCCM) guidelines, critically ill patients require continuous or near-continuous monitoring at intervals of one hour or less. Point-of-care blood glucose testing serves as the standard for safe intravenous insulin administration. Healthcare facilities must implement validated written or computerized protocols that allow predefined adjustments based on glycemic fluctuations. The ADA also recommends A1C testing for all patients with diabetes or those with random glucose levels exceeding 140 mg/dL if no result exists from the prior three months.
What Are the Recommended Monitoring Protocols?
The recommended monitoring protocols for blood glucose during IV therapy follow strict clinical guidelines. The ADA specifies blood glucose checks every 30 minutes to 2 hours for IV insulin therapy. SCCM guidelines mandate continuous or near-continuous monitoring at one-hour intervals or less for critically ill patients. Point-of-care blood glucose testing remains the standard requirement for safe intravenous insulin use. Healthcare providers must follow validated written or computerized protocols that enable predefined adjustments based on glycemic fluctuations. The ADA recommends A1C testing for all patients with diabetes or random glucose above 140 mg/dL without results from the previous three months. These protocols ensure timely detection and correction of dangerous blood glucose variations during IV therapy.
How Often Should Blood Glucose Be Checked for At-Risk Patients?
The frequency of blood glucose checks for at-risk patients depends on their clinical status and treatment regimen. Patients receiving IV insulin infusions require monitoring every 30 minutes to 2 hours. The transition period from IV to subcutaneous insulin demands more frequent monitoring during the 1-4 hour overlap phase. Continuous glucose monitoring (CGM) provides real-time tracking and detects glycemic patterns that point-of-care testing may miss. Medical ICU patients need enhanced monitoring frequency due to elevated hypoglycemia risk. Patients with acute respiratory failure and sepsis require increased monitoring intervals to prevent complications. These monitoring frequencies help healthcare providers maintain safe blood glucose levels while minimizing the risk of hypoglycemic or hyperglycemic events during IV therapy.
Why Do Ingredients in IV Therapy Have Varying Effects on Blood Sugar?
Different IV therapy ingredients affect blood sugar through distinct biochemical mechanisms. Glucose-containing solutions directly increase blood glucose by adding dextrose to the bloodstream, while non-glucose fluids maintain metabolic stability. Understanding these variations helps clinicians select appropriate IV formulations based on patient glucose control needs.
How Do Glucose-Containing vs. Non-Glucose IV Fluids Compare?
Glucose-containing and non-glucose IV fluids show markedly different effects on blood sugar levels. A clinical study tracking hyperglycemic episodes found dextrose-containing fluids caused elevated blood glucose in 16 patients at 30 minutes, 38 patients at 60 minutes, and 60 patients at 90 minutes. Ringer’s Lactate demonstrated zero hyperglycemic events throughout surgery in nondiabetic patients.
The rescue insulin requirement was significantly higher in the dextrose group, which used the CBG/100 formula for dosing calculations. Solutions containing 0.45% dextrose normal saline plus 20 mmol/L potassium chloride increased blood glucose more than Ringer’s Lactate alone. The blood glucose effect proved directly proportional to the dextrose concentration in each IV solution.
These findings demonstrate that non-glucose crystalloid solutions like Ringer’s Lactate provide superior glycemic stability compared to dextrose-containing alternatives during IV therapy administration.
Do Vitamins or Minerals in IV Therapy Impact Blood Glucose Levels?
Vitamins and minerals in IV therapy may influence blood glucose through various pathways. Glucocorticoid-associated hyperglycemia requires ongoing blood glucose monitoring with appropriate insulin dosing adjustments. Adding potassium chloride at 20 mmol/L to dextrose solutions does not prevent the hyperglycemic effects of the dextrose component.
Current research explores nanocarrier-based drug delivery systems for insulin to improve glucose management during IV therapy. Limited clinical trial data exists on specialized IV formulations containing vitamins and minerals and their specific glucose effects.
The interaction between IV additives and blood glucose remains an active area of investigation, with most current evidence focusing on corticosteroid effects rather than micronutrient impacts on glycemic control.
What Are the Possible Complications of IV Therapy on Blood Glucose?
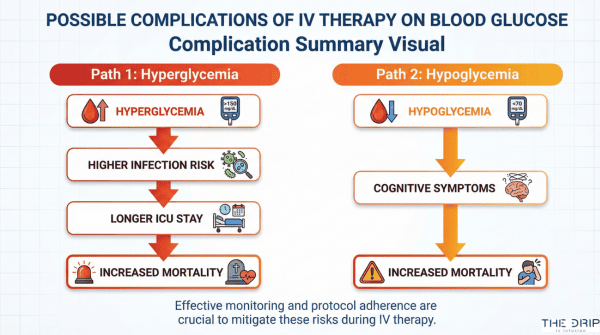
IV therapy complications on blood glucose include both hypoglycemia and hyperglycemia, with each carrying distinct risks for patient outcomes. These glycemic disturbances affect hospital mortality, length of stay, and infection rates. Understanding these complications helps healthcare providers optimize IV therapy protocols and improve patient safety.
Can IV Therapy Trigger Hypoglycemia or Hyperglycemia?
IV therapy can trigger both hypoglycemia and hyperglycemia, with hyperglycemia occurring in 70-80% of critically ill patients and hypoglycemia affecting 12.7% of ICU patients. A 2016 study on intensive glucose control found a 4.86-fold increase in hypoglycemia risk (95% CI 3.16-7.46). Severe hypoglycemia occurs in 2.2% of ICU patients receiving IV therapy.
Spontaneous hypoglycemia shows higher mortality at 53.9% compared to 42.4% for insulin-related hypoglycemia. ICU hyperglycemia above 180 mg/dL affects 32.2% of ICU patients and 32.0% of non-ICU patients. These complications arise from the interplay between IV solution composition, underlying illness severity, and glucose control protocols.
What Symptoms Should Patients and Providers Watch For?
The symptoms patients and providers should watch for include impaired neutrophil function when hyperglycemia exceeds 180-200 mg/dL, which increases infection likelihood. A 2018 analysis revealed hypoglycemia is associated with 48.9% hospital mortality versus 15.9% without hypoglycemia (P<0.001).
ICU length of stay extends to 14.4±10.1 days with hypoglycemia compared to 7.8±7.4 days without. Hospital length of stay increases to 20.6±10.4 days with hypoglycemia versus 16.6±10.0 days without. Glycemic variability independently raises mortality risk even with slight hyperglycemia, making continuous monitoring essential for early detection and intervention.
How Can Patients and Providers Minimize Blood Glucose Fluctuations With IV Therapy?
Patients and providers can minimize blood glucose fluctuations with IV therapy through insulin infusion protocols, continuous monitoring, and education. A 2020 study on insulin infusion therapy found a CONGA reduction of -0.65 (95% CI [-1.16, -0.14], P=0.01), demonstrating decreased glycemic variability. Standardized protocols outperform sliding scale methods while specialist diabetes teams reduce hyperglycemia without increasing hypoglycemia risk.
What Strategies Help Prevent Adverse Blood Sugar Effects?
The strategies that help prevent adverse blood sugar effects are insulin infusion therapy, standardized protocols, immediate glucose administration, specialist consultation, and continuous staff education. Insulin infusion therapy (IIT) reduces glycemic variability with a CONGA measurement of -0.65 (95% CI [-1.16, -0.14], P=0.01). Standardized insulin therapy protocols improve both efficiency and safety compared to sliding scale methods.
Immediate intervention requires 15-20g glucose administered intravenously when hypoglycemia occurs during insulin use. Specialist inpatient diabetes team consultation decreases hyperglycemia without increasing hypoglycemia rates. Continuous staff education remains critical for successful implementation of glycemic control protocols.
| Glycemic Control Strategy | Measured Outcome | Reported Value | Evidence Source |
| Insulin Infusion | CONGA Reduction | -0.65 (95% CI [-1.16, -0.14]) | Clinical Trial |
| Glucose Rescue | Dose | 15-20g IV | ADA Guidelines |
| Specialist Teams | Hyperglycemia Reduction | Significant | Hospital Data |
| Staff Education | Protocol Success | Critical | Implementation Studies |
These evidence-based strategies create a comprehensive approach to preventing glucose fluctuations during IV therapy administration.
How Should IV Therapy Be Adjusted for Those With Blood Glucose Concerns?
IV therapy should be adjusted for those with blood glucose concerns by following specific glycemic targets and transition protocols. Critically ill ICU patients require glycemic targets of 140-180 mg/dL (7.8-10.0 mmol/L) per ADA guidelines. Non-critically ill patients maintain targets of 100-180 mg/dL (5.6-10.0 mmol/L).
Targets below 110 mg/dL (6.1 mmol/L) are not recommended due to hypoglycemia risk. The starting threshold for IV insulin should be no higher than 180 mg/dL (10.0 mmol/L). Transition from IV to subcutaneous insulin typically uses 75-80% of the total daily IV dose divided into basal and prandial components.
| Patient Type | Target Range | Conversion |
| ICU Patients | 140-180 mg/dL | 7.8-10.0 mmol/L |
| Non-ICU | 100-180 mg/dL | 5.6-10.0 mmol/L |
| Minimum Safe Target | >110 mg/dL | >6.1 mmol/L |
| IV Insulin Threshold | ≤180 mg/dL | ≤10.0 mmol/L |
| Transition Dose | 75-80% | Basal + Prandial |
These adjustment protocols ensure safe blood glucose management while minimizing hypoglycemia risk during IV therapy transitions.
What Should You Consider If Interested in IV Therapy and Blood Glucose Support?
IV therapy and blood glucose management require careful medical evaluation before treatment. Professional healthcare providers assess individual risk factors, monitor glucose levels, and select appropriate IV solutions based on patient history. The following considerations help determine if IV therapy aligns with blood glucose management needs.
Can Professional IV Therapy Services Assist With Blood Glucose Management?
Professional IV therapy services for blood glucose management face significant evidence limitations outside hospital settings. Wellpoint guidelines indicate insufficient scientific evidence supports the safety or effectiveness of outpatient IV insulin therapy. Limited evidence exists on blood glucose safety in non-hospital IV therapy settings, such as wellness clinics and home IV therapy programs.
Real-time continuous glucose monitoring promotes safety and improves time efficiency in professional settings. A 2022 study on inpatient diabetes management programs found cost-effectiveness with a $12,127 reduction in acute complications despite a $10,456 increase in monitoring costs. This same analysis revealed a return on investment of 467% for structured diabetes management programs.
Healthcare providers considering IV therapy for glucose support must weigh these evidence gaps against potential benefits. Professional services require robust monitoring protocols and emergency response capabilities to manage glucose fluctuations safely.
What Are the Key Takeaways About How IV Therapy Impacts Blood Glucose Levels?
The key takeaways about how IV therapy impacts blood glucose levels center on solution selection and monitoring requirements. Ringer’s Lactate proves superior to dextrose-containing solutions for maintaining stable blood glucose during IV administration. Hyperglycemia affects 22-46% of non-critically ill patients and 70-80% of critically ill hospitalized patients receiving IV therapy.
Hypoglycemia presents serious risks with a 6.8% incidence in hospitalized diabetics and an associated 48.9% mortality rate. Blood glucose monitoring remains essential every 30 minutes to 2 hours during IV insulin therapy. The total estimated U.S. cost for treating diabetes reached $413 billion in 2022, representing 25% of all healthcare spending.
These findings emphasize that IV therapy’s glucose effects depend on solution type, patient condition, and monitoring frequency. Patients considering IV therapy should discuss these impacts with healthcare providers to ensure appropriate glucose management strategies.